What Is a Waveform in Sound? A Plain-English Guide
What Is a Waveform in Sound? A Plain-English Guide
A waveform in sound is a graph of how air pressure (or the signal that represents it) changes over time. The horizontal axis is time; the vertical axis is amplitude, which we hear as loudness. The number of times the wave repeats each second is its frequency, which we hear as pitch. Every recording you have ever played is stored as a waveform, and sound wave art is simply a stylised drawing of one.
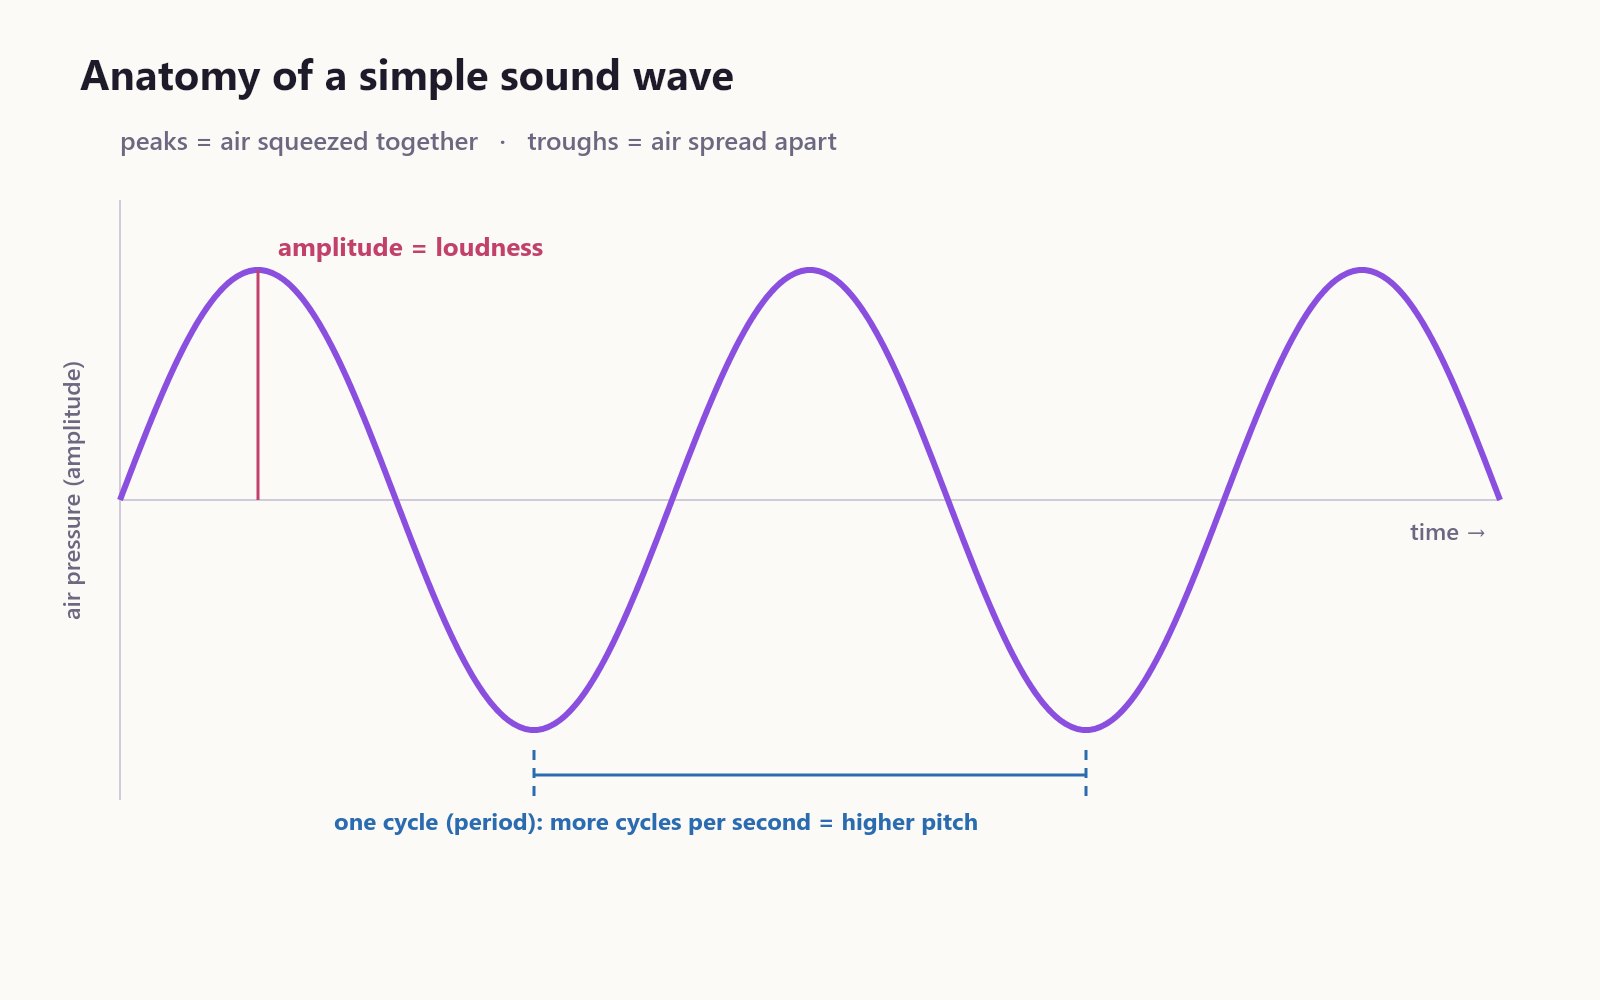 The parts of a simple sound wave. Diagram made for this article.
Key facts
- Sound is a pressure wave. A vibrating object pushes air molecules together (compression) and apart (rarefaction).
- Amplitude is the size of those pressure changes. Bigger amplitude sounds louder.
- Frequency is how many cycles happen per second, measured in hertz (Hz). Higher frequency sounds higher in pitch.
- Human hearing covers roughly 20 Hz to 20,000 Hz, narrowing with age.
- Digital audio stores the waveform as samples. CD-quality audio uses 44,100 samples per second.
- Real sounds are complex. Voices and instruments mix many frequencies, so their waveforms look jagged rather than smooth.
The parts of a waveform
Amplitude. The height of the wave from the centre line. In a waveform display, loud moments are tall and quiet moments are short. Amplitude is often measured in decibels (dB), a logarithmic scale, which is why a sound that seems "twice as loud" needs much more than twice the energy.
Frequency and period. One full up-and-down is a cycle. The time one cycle takes is the period. Frequency is the number of cycles per second. Concert A is 440 Hz: 440 cycles each second.
Wavelength. The physical distance one cycle covers in air. Because sound travels at roughly 343 metres per second in room-temperature air, a 440 Hz tone has a wavelength of about 78 cm, while a deep 50 Hz bass note is nearly 7 metres long.
Phase. Where in its cycle a wave is at a given moment. Phase matters when two sounds combine: in step they reinforce each other, out of step they can cancel out.
Timbre. Why a piano and a violin playing the same note sound different. Each instrument adds its own mix of overtones, which changes the waveform's shape without changing its basic frequency.
Simple vs complex waveforms
- Sine wave: a pure tone with one frequency. Smooth and regular, like a tuning fork.
- Square, triangle and sawtooth waves: classic synthesiser shapes rich in overtones.
- Speech: bursts of complex waves for each syllable, with small gaps between words.
- Music: many instruments layered, with rhythmic peaks from drums.
- Noise: random pressure changes with no repeating pattern, such as wind or static.
Zooming in and zooming out
The word "waveform" describes two views of the same data.
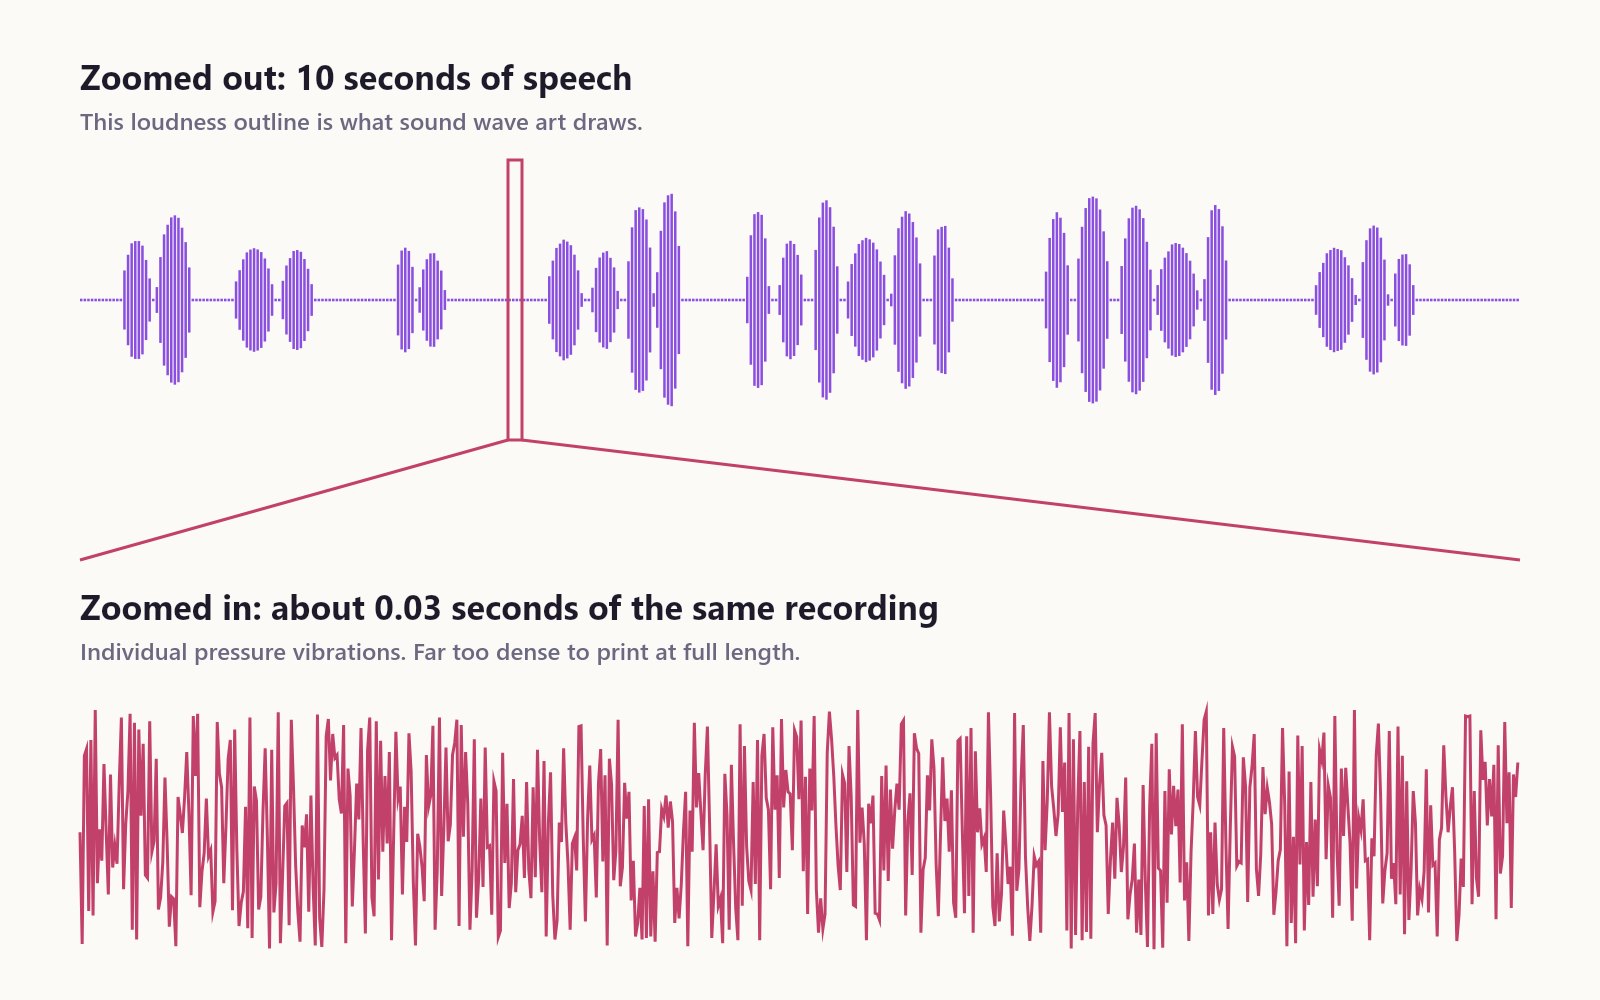 Zoomed out, you see the loudness outline. Zoomed in, you see individual vibrations. Diagram rendered from an example recording.
Zoomed in to a few milliseconds, you see the actual vibrations: the rapid back-and-forth of pressure. This is what an oscilloscope shows.
Zoomed out to several seconds, the vibrations blur into an outline of loudness over time, called the amplitude envelope. Audio editors, voice-message bubbles and music apps show this view. It is also what sound wave art draws, because it shows words, beats and pauses clearly.
How a recording captures a waveform
- A microphone turns pressure changes into a tiny electrical voltage that follows the same shape.
- An analogue-to-digital converter measures that voltage thousands of times a second (the sample rate) with a certain precision (the bit depth, such as 16-bit).
- The file stores the list of measurements, either as-is (WAV, FLAC) or compressed (MP3, AAC, OGG).
- On playback, the numbers drive a speaker cone back and forth, recreating the pressure wave in the air.
Compression formats like MP3 discard detail you are unlikely to hear, but the loudness outline survives, which is why an MP3 and a WAV of the same song produce almost the same sound wave print.
Reading a waveform at a glance
Once you know what to look for, a zoomed-out waveform tells you a lot:
- Tall, regular spikes: drums or a strong beat.
- A dense band that suddenly gets taller: a song moving from verse to chorus.
- Short bursts with gaps: speech, one burst per syllable or word.
- A long, even ribbon: a sustained sound such as a purr, a hum or a held note.
- A flat line: silence, or a recording that is far too quiet.
- Peaks squashed flat at the top: clipping, where the recording was too loud for the equipment.
Waveform vs spectrum
A waveform shows amplitude over time. A spectrum shows how much of each frequency is present at a moment. Music visualizers often use a spectrum (bars jumping for bass, mids and treble), while sound wave prints use the waveform. Read spectrum analyzers in music for the other view.
From waveform to wall art
 Photo: Tima Miroshnichenko on Pexels
A sound wave art generator takes the zoomed-out view and styles it. In the Shimga editor:
- Open /sound-wave-art-generator/create and upload or record audio. It is decoded in your browser.
- The overview strip under Pick a segment is a quick online waveform viewer for the whole file.
- Select a segment. The editor measures the loudness of hundreds of tiny slices.
- Each slice becomes a bar, dot or point, in one of 12 styles.
- Add colours and text, then export a print file at 300 DPI. Designing and previewing are free; clean downloads start at $3.99.
The complete sound wave art generator guide explains every option, and waveform art ideas has 20 things to make.
FAQ
What is a waveform in simple terms? A picture of a sound: how strong the sound is at each moment, drawn as a line or bars from left to right.
What does the height of a waveform mean? Amplitude, which we hear as loudness. Taller means louder.
Can you tell pitch from a waveform? Zoomed in, yes: tightly packed cycles mean a higher pitch. Zoomed out, the outline mostly shows loudness and rhythm, not pitch.
Why do two people saying the same word have different waveforms? Each voice has its own timbre, speed and loudness, so the shape differs. That is why voice prints feel personal.
How can I view the waveform of an audio file online? Load it into a browser tool that draws waveforms. The Shimga editor shows an overview of the whole file and a styled waveform of the part you select. See the waveform maker guide.
Is a waveform the same as a sound wave? A sound wave is the physical pressure wave in the air. A waveform is the graph that represents it.
Explore your own sound
The quickest way to understand waveforms is to look at one you know. Record your own voice in the sound wave art editor and watch the shape appear.
Last updated: October 2026