Spectrum Analyzers in Music: How They Work and Look
Short answer: A spectrum analyzer uses a Fast Fourier Transform to show how much energy an audio signal has at each frequency, with bass on the left and treble on the right. Producers use it to check mixes and masters; music visualizers use the same data to animate bars, rings and particles. In Shimga Studio you can turn a track's spectrum into a circular or bar spectrum video and export it as MP4.
Last updated 21 October 2026.
What is a spectrum analyzer and how does it work?
A spectrum analyzer breaks an audio signal into its frequency components and plots amplitude against frequency. It gives an objective picture of what you hear: whether a mix is bass-heavy, where a harsh resonance sits, or how much high-frequency air a master has.
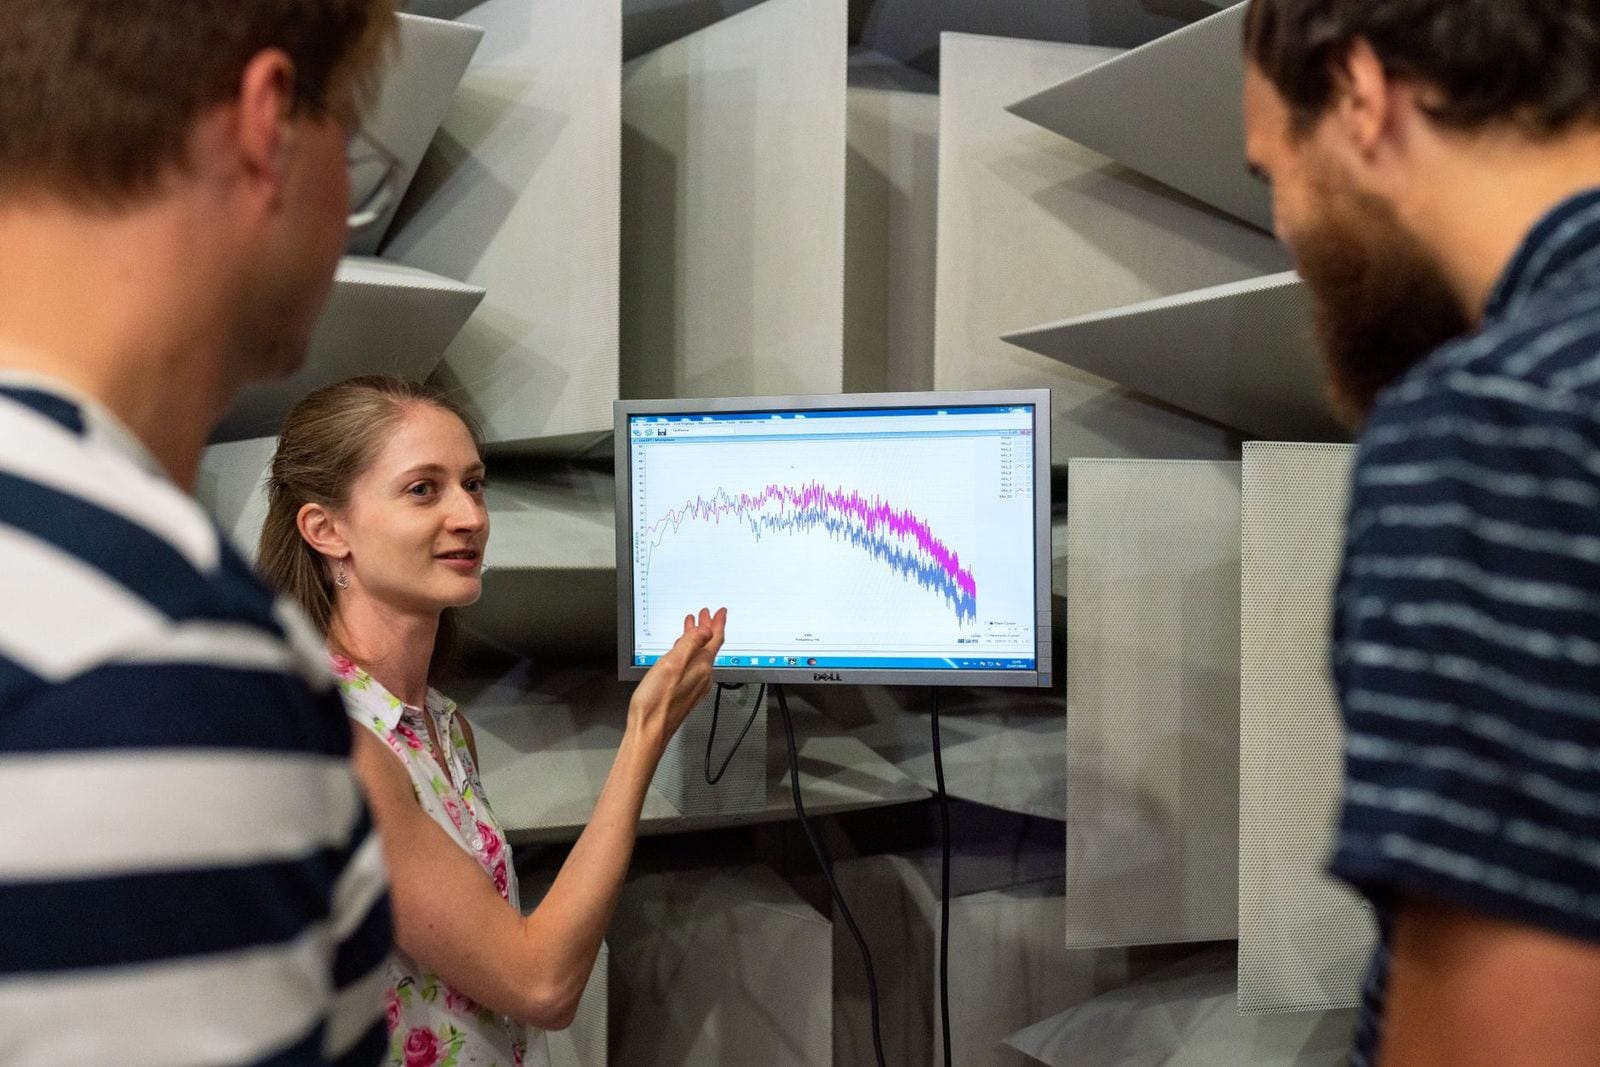
Photo: ThisIsEngineering on Pexels
Almost every analyzer relies on the Fast Fourier Transform (FFT). The FFT takes a short window of samples and calculates the energy at each frequency bin. Two settings shape the result:
- Window size (commonly 512, 1024, 2048 or 4096 samples): larger windows give finer frequency detail but update more slowly.
- Amplitude scale: shown in decibels, a logarithmic scale that matches how we perceive loudness. Digital audio tops out at 0 dBFS.
Why do producers use spectrum analyzers?
Ears adapt to rooms, and untreated rooms exaggerate or hide certain frequencies. An analyzer shows what the signal contains regardless of the room.
- Mixing and EQ: spot masking, where two instruments crowd the same range, and decide which to cut.
- Mastering: compare your master against a reference release to see if the low end is too heavy or the top too bright.
- Dynamic processing: find the bands that spike unpredictably and target them with a multiband compressor or dynamic EQ.
Screenshot: shimga.app
How do you read a spectrum analyzer?
Bass sits on the left, treble on the right, and level rises upward. Most analyzers show roughly 20 Hz to 20 kHz on a logarithmic frequency axis, so each octave takes the same width.
| Zone | Range | What it contributes |
|---|---|---|
| Sub-bass | 20-80 Hz | Felt more than heard; the weight of kicks and bass lines |
| Bass | 80-250 Hz | Warmth and body; too much sounds muddy |
| Midrange | 250 Hz-4 kHz | Melody and vocals, where hearing is most sensitive |
| Presence | 4-8 kHz | Articulation and definition |
| Air | 8-20 kHz | Shimmer, openness and space |
A balanced master usually shows a solid but controlled low end, a gentle roll-off toward the top, and no narrow peak standing far above its neighbours. A sharp spike is worth investigating: it may be an instrument resonance, a room mode in the recording or a plugin artifact. To check tempo or trim a section before analysing it, try the BPM Finder or Audio Trimmer.
What types of spectrum display exist?
| Display | How it looks | Best for |
|---|---|---|
| Bar spectrum | Vertical bars from bass (left) to treble (right) | Readable, classic music-video look |
| Waterfall | Time scrolls while frequency runs across | Seeing tonal change across a song |
| Spectrogram | Colour shows energy over time | Sound design and detailed analysis |
| Circular spectrum | Bins arranged around a ring | Symmetrical, striking YouTube and social visuals |
How to make a spectrum animation in Shimga: step by step
- Open Shimga Studio in Chrome or Edge. There is nothing to install and you can build without signing in.
- Add your audio (MP3, WAV, OGG, FLAC or M4A). It is analysed in your browser.
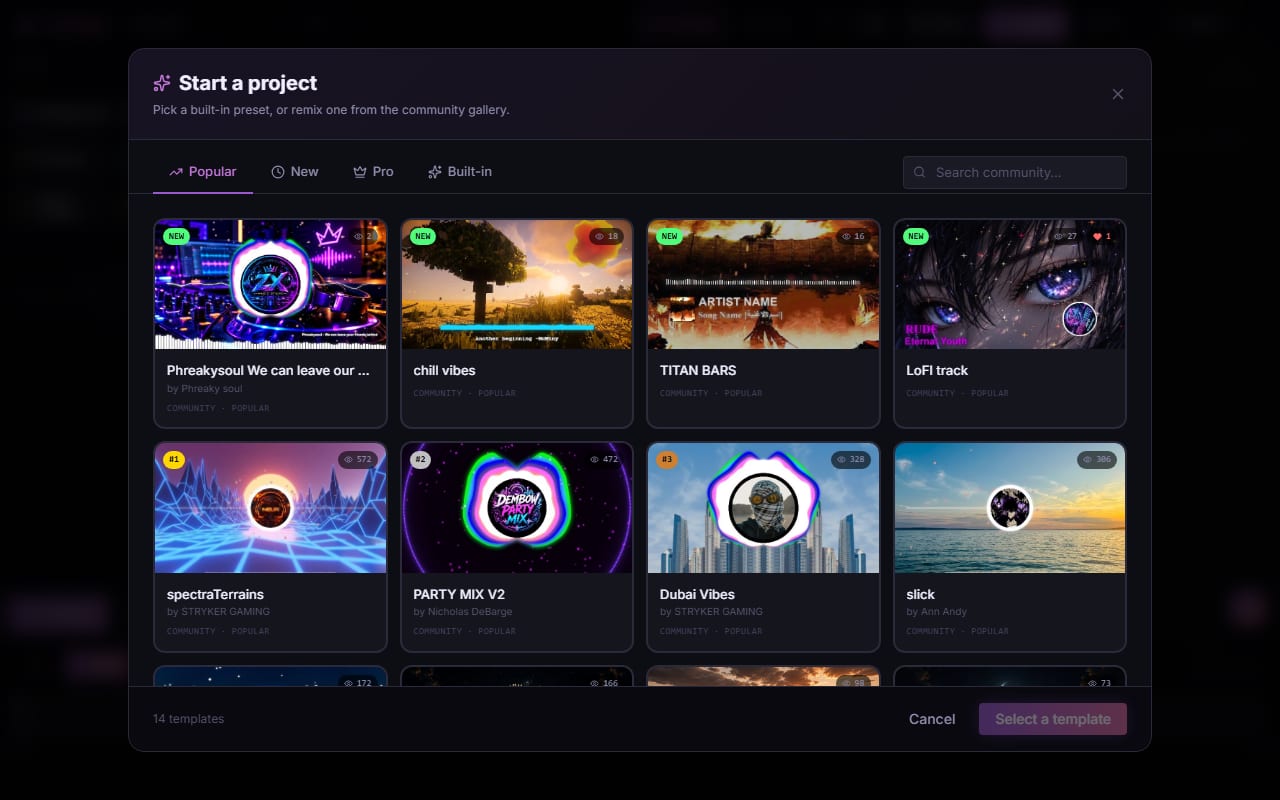
- Choose a circular spectrum, bar spectrum or waveform preset from the presets, or start from a template.
- Customise colours, bar count, glow, background image and logo, and press play to preview in real time.
- Pick the canvas ratio: 16:9 for YouTube, 9:16 for Reels, TikTok and Shorts, or 1:1 for square posts.
- Export as MP4. No sign-in is needed. Standard scenes up to 5 minutes do not need Pro (currently up to 4K and 60 fps); Pro elements and longer videos do.
Photo: Egor Komarov on Pexels
Colour tips for spectrum visuals
- Bass bars move the most; give them the boldest colour.
- Mid bars are dense and fast; a hue gradient across them adds texture.
- High bars move quickly with small amplitude; bright accent colours keep them visible.
- Brightness mapping (dark when quiet, bright on peaks) is an easy way to show dynamics. See colour theory for visualizers.
For how bands map to motion, read audio frequency reactivity, and for the dedicated tool page see the audio spectrum generator.
Frequently asked questions
What is the difference between a spectrum analyzer and an equalizer?
A spectrum analyzer only displays the frequency content of audio. An equalizer changes the sound by boosting or cutting frequency ranges. They are often used together: the analyzer shows what is there and the EQ fixes it.
Do I need a spectrum analyzer to make good music?
No, but it helps when mixing and mastering, especially in an untreated room. It gives objective data that helps mixes translate to headphones, car speakers and streaming.
Can I use Shimga as a spectrum analyzer for my own audio?
Shimga is a music visualizer built for making videos, so it shows the frequency content of your track as it plays. For precise mixing and mastering measurements, a dedicated analyzer plugin in your DAW is more suitable.
What is the best spectrum display for a YouTube music video?
Bar and circular spectrums are the most common because they are easy to read at a glance. Circular spectrums with a centre logo are popular for YouTube and thumbnails.
Turn your track's spectrum into a video
Pick a spectrum preset, add your artwork and export an MP4 from your browser.
Open Shimga Studio →