Audio Frequency Reactivity: Bass, Mids and Highs Explained
Short answer: Audio reactivity means visuals are driven by what is actually in the signal. An FFT splits the audio into frequency bands such as bass, mids and highs, so each band can control a different visual property. In Shimga you link numeric settings to bass, mids, highs or overall level, then tune smoothing so the motion suits your genre.
Last updated 21 October 2026.
What does audio reactivity actually mean?
An audio-reactive visual is one whose properties (size, colour, position, particle count) are computed from the audio signal rather than animated by hand. The simplest version responds to overall loudness. A richer version listens to the whole frequency spectrum, so a kick drum, a pad and a hi-hat can each move something different at the same moment.
Photo: Anna Pou on Pexels
There are four common ways a visualizer can read a track:
- Amplitude: overall volume over time. Good for expressive, dynamic performances.
- Frequency (spectrum): energy in each frequency band. This is what makes bass, mids and highs look different.
- Beat detection: finding rhythmic peaks and firing an event on each one. See BPM detection and beat sync.
- Transients: the sharp attack of a drum hit or plucked note, useful for short bursts.
In Shimga Studio you can link numeric settings to the bass, mids, highs or overall level of the track, which covers the amplitude and frequency cases directly. For the design side, read audio-reactive visuals that feel musical.
Which frequency ranges matter: bass, mids and highs
Human hearing spans roughly 20 Hz to 20,000 Hz. Producers divide it into bands, and each band has a recognisable character that maps naturally onto a visual quality.
| Band | Approx. range | What you hear | Good visual target |
|---|---|---|---|
| Bass | 20-250 Hz | Kick, bass guitar, 808s, sub-bass | Scale, pulse, glow, camera zoom |
| Low mids | 250-500 Hz | Warmth of piano, vocal body, snare body | Overall brightness, soft movement |
| Mids | 500 Hz-2 kHz | Melody, guitars, pads, vocals | Hue rotation, rotation speed |
| Upper mids | 2-4 kHz | Presence, consonants, attack | Edge detail, outlines |
| Highs | 4-20 kHz | Hi-hats, cymbals, air, shimmer | Particle emission, sparkle, grain |
A reliable starting rule: let bass drive big geometry, mids drive colour, and highs drive small detail. Mapping every property to the same input is the most common reason a visualizer looks muddy.
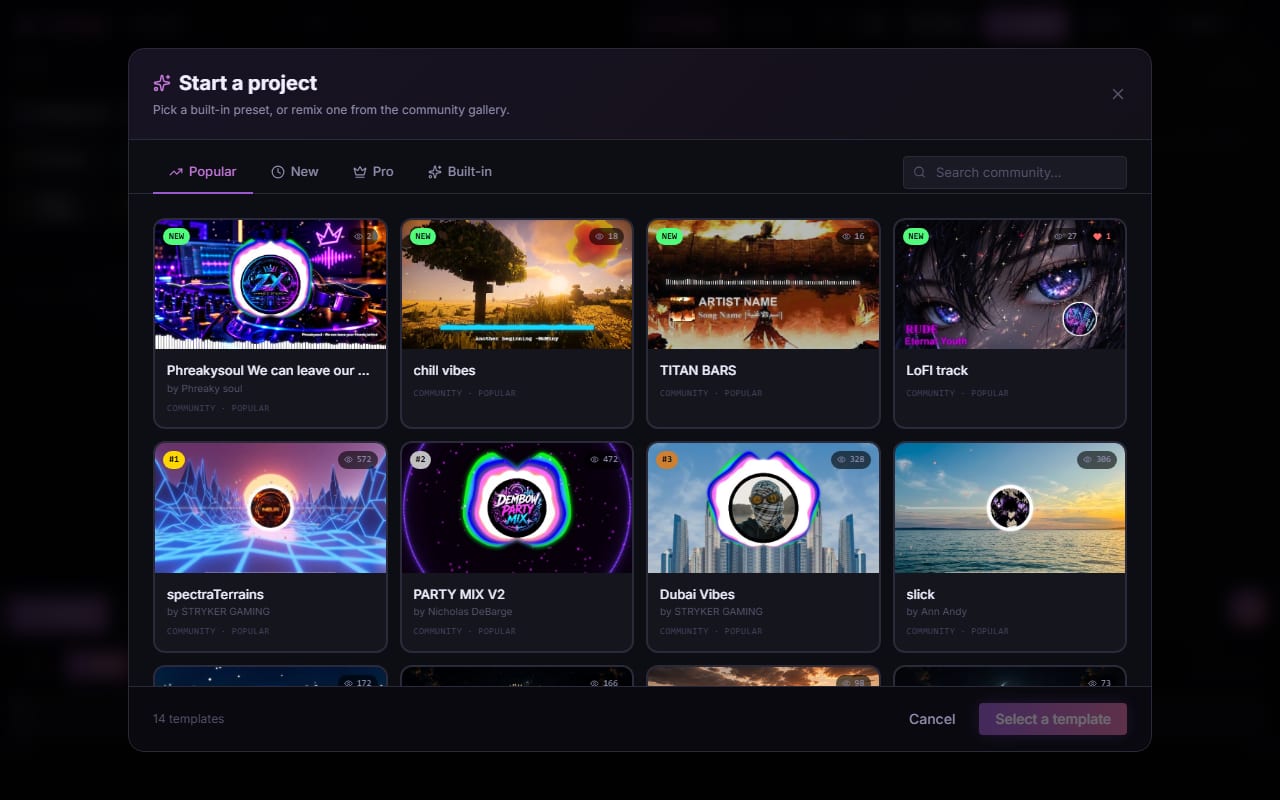
Screenshot: shimga.app
How does an FFT turn audio into frequency data?
The Fast Fourier Transform converts a short window of audio samples (a waveform) into the amount of energy at each frequency. In a browser this is exposed by the Web Audio API's AnalyserNode, which returns an array of values called frequency bins. A larger fftSize gives finer frequency resolution but responds more slowly. Shimga's live preview analyser uses a 2048-sample FFT.
The other key control is smoothing, which blends each new reading with the previous one:
- High smoothing (towards the maximum) gives slow, fluid motion, good for ambient and classical music.
- Low smoothing makes visuals snap to every hit, good for tight electronic and hip-hop.
Spectrum layers in Shimga expose a Smoothing slider (lower is snappier), so you can tune it per scene. When you export, the audio is analysed offline, frame by frame, so every video frame uses the exact audio data for its moment and the result stays in sync even if your computer is busy.
How to tune reactivity for your track: step by step
- Load your track in Shimga Studio (MP3, WAV, OGG, FLAC or M4A).
- Pick a starting preset or community template close to your genre.
- Link one property per band: for example scale to bass, hue to mids, particle density to highs.
- Adjust smoothing while the track plays, listening for the point where motion feels tied to the music rather than jittery or laggy.
- Check the loudest section and a quiet section; if the quiet part barely moves, raise sensitivity there or add keyframes for the drop (see keyframe animation).
- Export an MP4 once the preview looks right.
Photo: cottonbro studio on Pexels
Reactivity settings by genre
| Genre | Spectral character | Suggested approach |
|---|---|---|
| EDM, trap, hip-hop | Bass-forward, tight transients | Strong bass link, moderate smoothing so shapes snap on kicks without flicker between them |
| Classical, orchestral | Wide dynamics, rich mids | Lower bass sensitivity, favour mids, high smoothing so visuals breathe with phrasing |
| Lo-fi, ambient | Narrow dynamics | Subtle links and high smoothing for a slow drift |
Mix quality matters too. A track that is compressed flat gives the analyser little variation, so reactivity looks weak. Leaving some dynamics in your master, or a modest low-end boost, gives the visuals more to work with. For more on reading spectrum displays, see spectrum analyzers explained.
Frequently asked questions
What is the difference between an FFT visualizer and a waveform visualizer?
A waveform visualizer draws the signal's amplitude over time. An FFT visualizer shows how much energy sits in each frequency band at each moment, so bass, mids and highs can drive different visual parameters at once.
Which frequency band should control which visual property?
A dependable starting point is bass for scale and pulse, mids for colour and rotation, and highs for small details like sparkle or particle emission. Adjust from there to suit the track.
Does smoothing change how reactive a visualizer looks?
Yes. High smoothing blends each reading with the previous one for slow, fluid motion, while low smoothing lets visuals snap to every hit. Pick higher values for ambient music and lower values for fast, percussive tracks.
Does my audio leave my computer when I use Shimga?
No. The audio is decoded and analysed in your browser. It is uploaded only if you choose to save a template that includes the audio file.
See your track's frequencies as visuals
Open the studio, drop in a track and link bass, mids and highs to your own settings. You can build and preview without signing in.
Open Shimga Studio →Related: audio-reactive visuals, GLSL shaders for music, the music visualizer page and the audio tools.